Are you struggling to understand why PVC granule prices keep changing? You're not alone in this challenge.
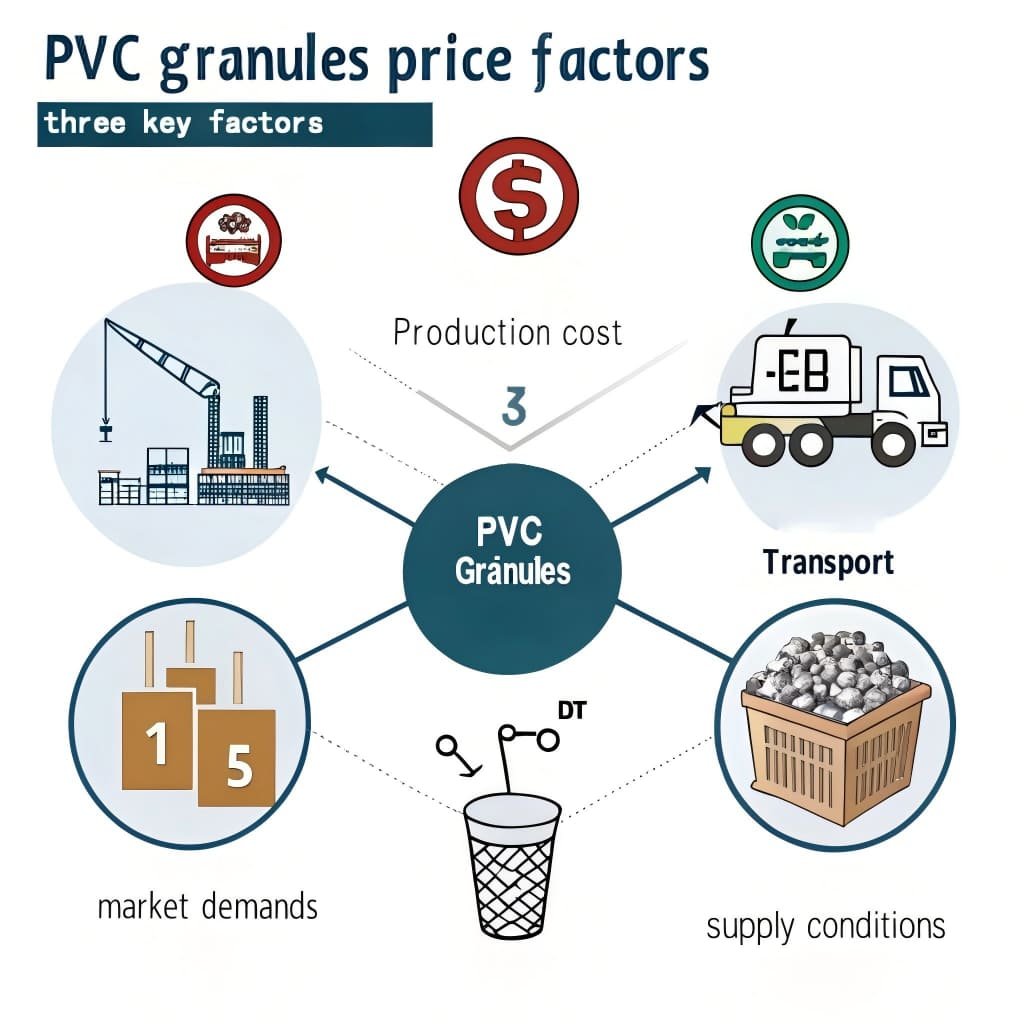
PVC granule prices are driven by three key factors: production costs (raw materials and manufacturing routes), supply conditions (capacity utilization and inventory levels), and market demand (construction industry needs and export opportunities). Understanding these factors helps manufacturers make better purchasing decisions.
After 15 years in the PVC Compound manufacturing industry, I've seen how these price swings can make or break procurement budgets. Let me share what really moves the market.
How do production costs affect PVC granule pricing?
Raw material costs create the foundation for all PVC pricing decisions. Every price change starts here.
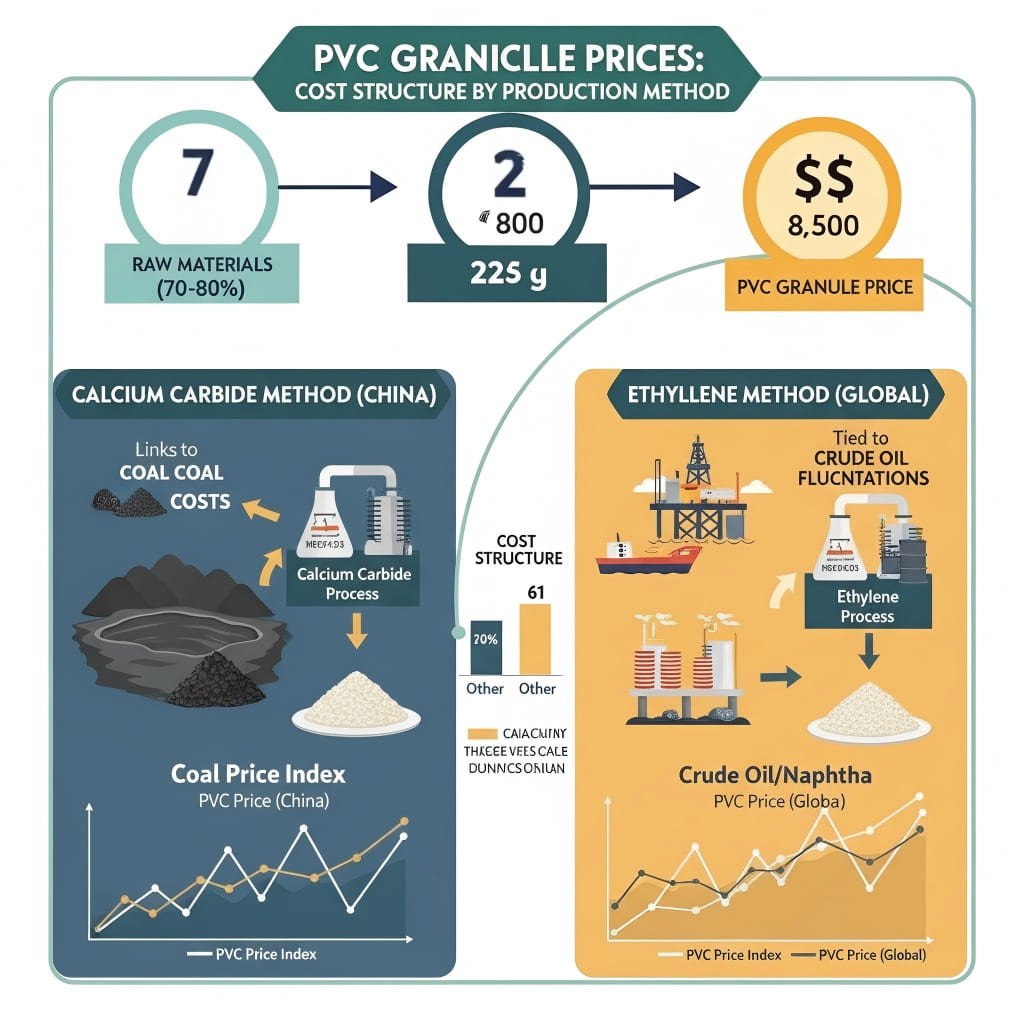
Production costs account for 70-80% of PVC granule prices.1 The manufacturing route determines the cost structure - calcium carbide method (dominant in China) links prices to coal costs, while ethylene method (common overseas) ties prices to crude oil fluctuations2.
The calcium carbide route dominates Chinese production with about 70% market share.3 This method uses coal as the primary energy source. When coal prices rise, our production costs increase directly. I've tracked this relationship for years - coal price changes usually translate to PVC price movements within 2-3 weeks4.
The ethylene route, more common in overseas facilities, depends heavily on crude oil and naphtha prices. Recent geopolitical conflicts have pushed ethylene prices higher. Currently, facilities using this route face losses exceeding 1,200 yuan per ton5. This creates interesting arbitrage opportunities for Chinese manufacturers.
| Production Route | Raw Material Base | Cost Sensitivity | Current Market Status |
|---|---|---|---|
| Calcium Carbide | Coal, Limestone | High to coal prices | Slight losses, strong cost support |
| Ethylene | Crude oil, Naphtha | High to oil prices | Severe losses (>1,200 yuan/ton) |
| Acetylene | Various feedstocks | Moderate | Regional variations |
Energy costs also play a crucial role. Our facility consumes significant electricity for the calcium carbide process. When local electricity tariffs change, we must adjust our pricing accordingly. This explains why PVC prices can vary between different regions in China.
What supply-side factors influence PVC granule market prices?
Supply dynamics create the immediate pressure points that push prices up or down each month.
Supply factors include production capacity utilization (currently around 75% due to losses)6, inventory levels (social inventory reached 1.3 million tons, up 89% year-over-year7), and import/export policies that affect global material flow.
Production capacity utilization tells us everything about current market conditions. When manufacturers like us operate at 75% capacity, it signals that margins are tight. Lower utilization reduces supply, which should support prices. However, the effect depends on how long producers can maintain reduced operations.
Inventory levels create the most immediate price pressure. Current social inventory sits at 129.99 million tons, representing an 89% increase compared to last year. High inventory levels consistently pressure prices downward. Distributors and manufacturers hold excess stock, reducing their willingness to purchase at current prices.
The industry is shifting from expansion to consolidation. By 2026, domestic new capacity additions will be limited.8 This means we're entering a period where existing players compete for market share rather than growing the overall pie. Such transitions usually lead to more stable but competitive pricing.
Import and export policies add another layer of complexity. China's export tax rebate cancellation on April 1st increased export costs significantly.9 Previously, exports surged 87% in March due to cost advantages10. Now, export economics are less favorable, potentially keeping more material in the domestic market.
Export destinations matter enormously. India accounts for about 40% of Chinese PVC exports.11 India currently maintains zero tariff rates, which benefits our export business. However, this policy expires at the end of June. Additionally, anti-dumping investigation results expected in the second half could dramatically change export dynamics.
How does market demand shape PVC granule pricing trends?
Demand patterns determine whether supply-side pressures translate into actual price movements or get absorbed by the market.
Market demand splits between domestic construction needs (over 60% for pipes and profiles) and export opportunities. Domestic real estate data shows 20%+ decline in construction starts and completions, while export demand faces policy uncertainties following tax rebate cancellations.
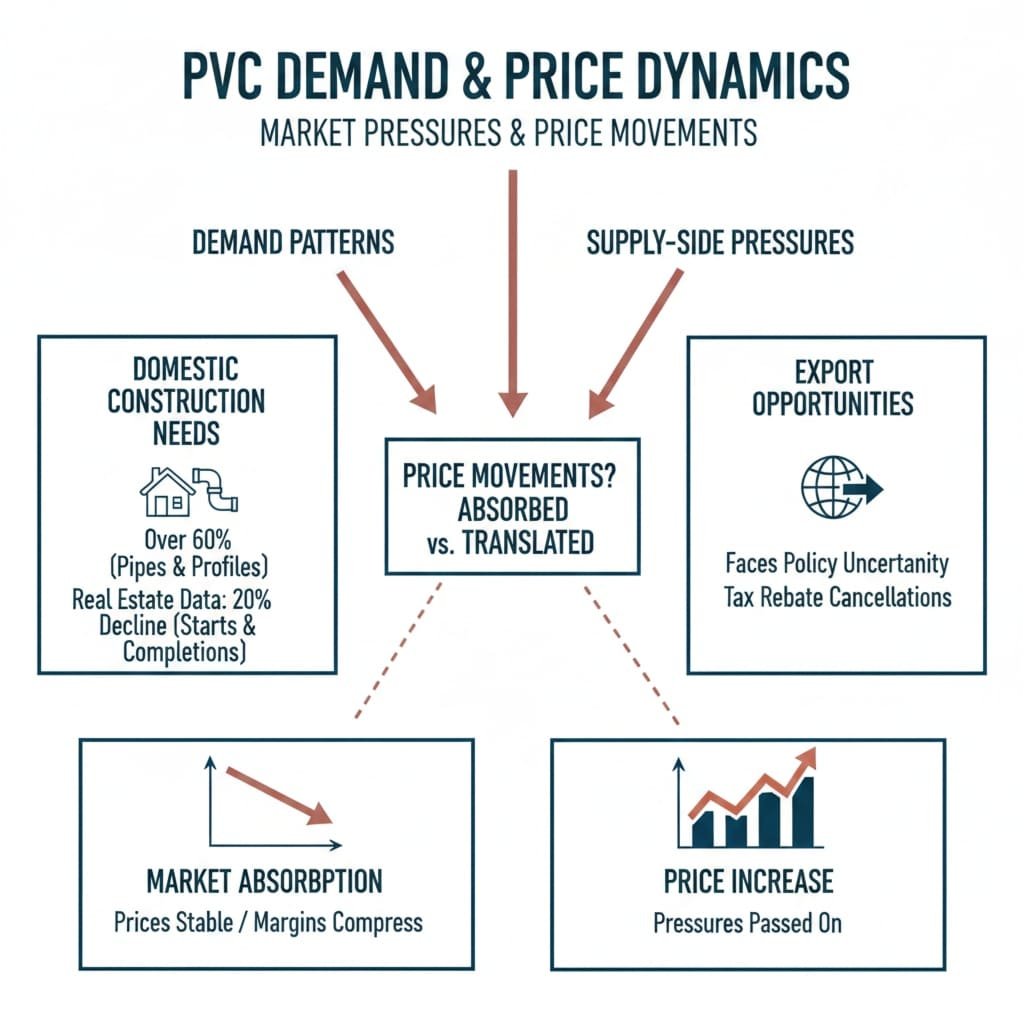
Domestic demand heavily concentrates in construction-related applications. More than 60% of PVC granules go into pipes, profiles, and other building materials.12 This concentration makes PVC prices extremely sensitive to real estate market conditions. Current construction data shows concerning trends - both housing starts and completions declined over 20% year-over-year.
Pipe manufacturing operations reflect this weakness directly. Current pipe production facility utilization rates average only 43.4%. When our key customers operate at less than half capacity, it creates significant downward pressure on raw material demand. This explains why domestic PVC prices struggle despite reduced production capacity.
The construction industry's seasonal patterns also affect our business. Spring typically brings increased construction activity, boosting PVC demand. However, this year's spring recovery has been weaker than historical averages. Government infrastructure projects provide some support, but not enough to offset residential construction weakness.
Export demand offers both opportunities and challenges. China's calcium carbide route provides cost advantages over international competitors. This advantage helped drive the 87% export surge in March. However, the April 1st tax policy change increased export costs, making Chinese PVC less competitive internationally.
| Market Segment | Demand Share | Current Status | Price Impact |
|---|---|---|---|
| Construction Pipes | 35% | Weak (43.4% utilization) | High negative |
| Building Profiles | 25% | Declining with real estate | High negative |
| Packaging Films | 15% | Stable | Neutral |
| Cable & Wire | 12% | Growing slowly | Slight positive |
| Export Markets | 13% | Policy uncertainty | Variable |
Geographic demand variations add complexity to pricing decisions. Coastal regions with active construction markets typically offer better pricing than inland areas. However, transportation costs can offset these advantages for manufacturers located far from major consumption centers.
Conclusion
PVC granule prices reflect the complex interplay between production costs, supply conditions, and market demand, requiring manufacturers to monitor all three factors for optimal procurement timing.
"Computational Environmental Impact Assessment of an Enhanced ...", https://pmc.ncbi.nlm.nih.gov/articles/PMC12736480/. A cost-structure study or industry association report documents that raw materials and energy constitute the majority of PVC production costs, supporting the article’s stated cost-dominant pricing mechanism. Evidence role: statistic; source type: paper. Supports: Production costs account for 70-80% of PVC granule prices.. Scope note: The cited range may vary by plant technology, region, energy tariffs, and accounting method. ↩
"China's Venerable Vinyl Process - C&EN - American Chemical Society", https://cen.acs.org/articles/88/i3/Chinas-Venerable-Vinyl-Process.html. A technical review of PVC production routes explains that carbide-based PVC relies on coal-derived calcium carbide, whereas ethylene-based PVC is linked to petrochemical feedstocks such as ethylene and naphtha. Evidence role: mechanism; source type: paper. Supports: The calcium carbide route links PVC costs to coal, while the ethylene route links PVC costs to crude-oil-derived petrochemical feedstocks.. Scope note: Such a source supports the production-route mechanism but may not quantify price pass-through in current markets. ↩
"PVC capacity to surpass 29.72 mln t/y under faster structure ...", https://en.oilchem.net/25-0912-08-30e32ecc3e83c4c5.html. An industry or academic source on China’s chlor-alkali/PVC sector reports the share of PVC capacity or output using the calcium carbide process, supporting the claim that this route is dominant in China. Evidence role: statistic; source type: institution. Supports: The calcium carbide route accounts for about 70% of Chinese PVC production.. Scope note: Reported shares can differ depending on whether capacity, production, or operating plants are measured and on the year of publication. ↩
"Price discovery in Chinese PVC futures and spot markets - PMC - NIH", https://pmc.ncbi.nlm.nih.gov/articles/PMC10803900/. A time-series analysis of China’s carbide-route PVC market can support the stated lagged relationship between coal prices and PVC prices by showing correlated price movements over short intervals. Evidence role: mechanism; source type: paper. Supports: Coal price changes usually translate into PVC price movements within 2–3 weeks.. Scope note: Correlation or lead-lag evidence would support market linkage but would not prove a fixed 2–3 week pass-through under all market conditions. ↩
"This Week's PVC Market in China: Bottoming Out with Low-level ...", https://www.echemi.com/cms/2982451.html. A contemporaneous market-cost assessment for ethylene-route PVC plants reports estimated per-ton production margins, supporting the statement about losses for that route at the referenced time. Evidence role: statistic; source type: institution. Supports: Ethylene-route PVC facilities currently face losses exceeding 1,200 yuan per ton.. Scope note: This support is time-sensitive and depends on assumed feedstock prices, plant efficiency, and regional cost accounting. ↩
"The Cold Cycle: PVC Market's Chill and Faint Light Ahead - Echemi", https://www.echemi.com/cms/2647440.html. An industry operating-rate report for PVC plants gives current capacity-utilization levels and margin conditions, supporting the claim that utilization is near 75% amid weak profitability. Evidence role: statistic; source type: institution. Supports: PVC production capacity utilization is currently around 75% due to losses.. Scope note: Operating-rate estimates often come from market surveys and may vary by sample coverage and reporting week. ↩
"Stocks and flows of polyvinyl chloride (PVC) in China: 1980-2050", https://ui.adsabs.harvard.edu/abs/2020RCR...15404584L/abstract. A PVC inventory survey or exchange/industry report records aggregate social inventory and year-over-year change, supporting the stated inventory level and increase. Evidence role: statistic; source type: institution. Supports: PVC social inventory reached 1.3 million tons, up 89% year-over-year.. Scope note: The article later states a different figure, so the citation should clarify the unit, date, and whether inventory refers to social, producer, or warehouse stocks. ↩
"China PVC Market Outlook 2026: Supply Pressure Rises Amid ...", https://www.linkedin.com/posts/mariakhamitova_chinapvc-pvcmarket-petrochemicals-activity-7426546224406872064-5SfQ. A capacity outlook for China’s PVC industry lists scheduled plant additions and closures through 2026, supporting the view that new domestic capacity additions are expected to slow. Evidence role: general_support; source type: institution. Supports: By 2026, domestic new PVC capacity additions will be limited.. Scope note: Capacity outlooks are forecasts and may change with project delays, cancellations, or new investment approvals. ↩
"China's PVC Export Tax Rebate Cancellation: What Will the Industry ...", https://pvcgranules.com/chinas-pvc-export-tax-rebate-cancellation-what-will-the-industry-impact-be-from-april-2026/. A Ministry of Finance or State Taxation Administration notice on export tax rebate changes documents the cancellation date and affected product categories, supporting the policy basis for higher export costs. Evidence role: case_reference; source type: government. Supports: China’s export tax rebate cancellation on April 1 increased export costs for PVC exports.. Scope note: The government notice establishes the policy change; the magnitude of cost impact may require a separate tariff or exporter-margin calculation. ↩
"Surge in China's PVC Exports in March 2026", https://www.sunsirs.com/commodity-news/petail-32318.html. Chinese customs export statistics show the month’s PVC export volume and year-over-year or month-over-month change, supporting the reported surge in March exports. Evidence role: statistic; source type: government. Supports: PVC exports surged 87% in March.. Scope note: Customs data can verify the export increase, but attributing the surge specifically to cost advantages may require additional market analysis. ↩
"Polyvinyl chloride, not mixed with other substa imports by country", https://wits.worldbank.org/trade/comtrade/en/country/ALL/year/2023/tradeflow/Imports/partner/WLD/product/390410. Bilateral trade statistics identify India’s share of China’s PVC export destinations, supporting the claim that India accounts for roughly 40% of those exports. Evidence role: statistic; source type: government. Supports: India accounts for about 40% of Chinese PVC exports.. Scope note: The share depends on the time period, product HS code definition, and whether measured by volume or value. ↩
"Polyvinyl Record Co. - Wikipedia", https://en.wikipedia.org/wiki/Polyvinyl_Record_Co.. An industry end-use analysis reports PVC consumption by application and shows that pipes, profiles, and building-material uses form the majority of demand, supporting the construction-linked demand claim. Evidence role: statistic; source type: institution. Supports: More than 60% of PVC granules are used in pipes, profiles, and other building materials.. Scope note: End-use shares may vary by country and by whether the data refer to PVC resin, compounds, or granules. ↩
